


Hi, I’m TestprepKart.
Your Partner In Exam Preparation
Wondering about your expected performance in JEE Main 2025–26? This page helps students estimate marks, percentile, and expected rank using previous years’ trends and NTA normalization patterns.
The JEE Main marks vs percentile data is especially useful for NRI Students in USA and aspirants from the Middle East (UAE) to understand performance expectations and plan counselling. Please note that these figures are indicative, as actual percentiles and ranks depend on exam difficulty and shift-wise normalization.
Final marks vs percentile data for the JEE Main April 2025 attempt is yet to be officially released by NTA.
This page will be updated once official data becomes available and will also guide students preparing for JEE Main 2026 and onward.
Get JEE Prep Help Download NRI JEE E-Book
Refer to the table below to estimate your JEE Main 2025 marks, percentile, and expected rank based on previous years’ trends. Higher percentiles generally require stronger scores, though actual results depend on exam difficulty and NTA’s normalization process across shifts.

Understanding the link between marks, percentile, and rank in JEE Main 2025 helps students evaluate their performance accurately. NTA uses a normalization process to convert raw marks into percentiles across shifts, which then determine ranks. This ensures fair comparison and clearer result interpretation.
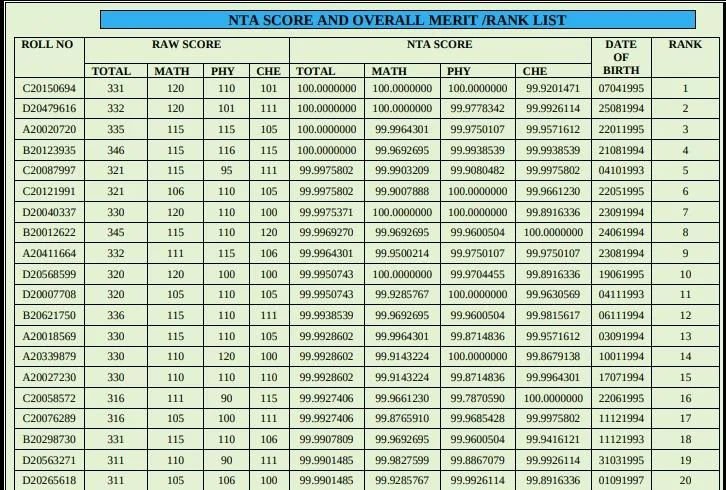
Expected JEE Main Marks vs Rank vs Percentile
| Score out of 300 | Rank | Percentile |
| 286- 292 | 19-12 | 99.99826992 – 99.99890732 |
| 280-284 | 42-23 | 99.99617561 – 99.99790569 |
| 268- 279 | 106-64 | 99.99034797 – 99.99417236 |
| 250- 267 | 524-108 | 99.95228621- 99.99016586 |
| 231-249 | 1385-546 | 99.87388626 – 99.95028296 |
| 215-230 | 2798-1421 | 99.74522293 – 99.87060821 |
| 200-214 | 4667-2863 | 99.57503767- 99.73930423 |
| 189-199 | 6664- 4830 | 99.39319714 – 99.56019541 |
| 175-188 | 10746-7152 | 99.02150308 – 99.3487614 |
| 160-174 | 16163-11018 | 98.52824811 – 98.99673561 |
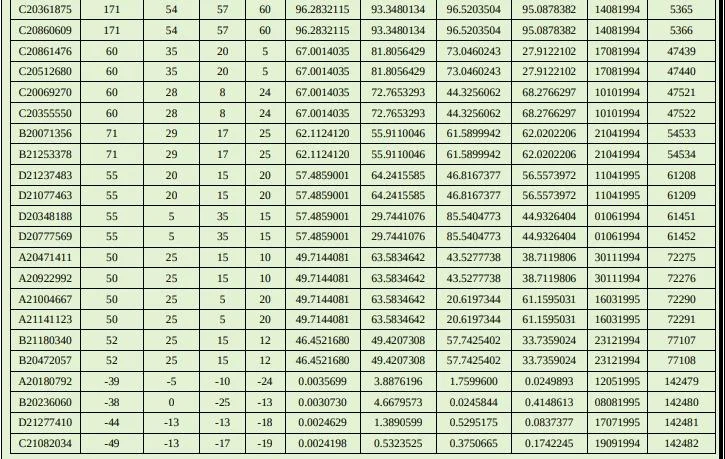
| 149-159 | 21145-16495 | 98.07460288 – 98.49801724 |
| 132-148 | 32826-22238 | 97.0109678 – 97.97507774 |
| 120-131 | 43174-33636 | 96.0687115 – 96.93721175 |
| 110-119 | 54293-44115 | 95.05625037 – 95.983027 |
| 102-109 | 65758-55269 | 94.01228357 – 94.96737888 |
| 95-101 | 76260-66999 | 93.05600452 – 93.89928202 |
| 89-94 | 87219-78111 | 92.05811248 – 92.88745828 |
| 79-88 | 109329-90144 | 90.0448455 – 91.79177119 |
| 62-87 | 169542-92303 | 84.56203931 – 91.59517945 |
| 41-61 | 326517-173239 | 70.26839007 – 84.22540213 |
| 1-40 | 1025009-334080 | 6.66590786 – 69.5797271 |
Check: Download JEE Main Previous Year Question Papers PDF
Understanding the connection between marks, percentile, and rank in JEE Main 2025 is crucial for students. The marks vs percentile vs rank for JEE Main 2025 represent the percentile scores linked to specific marks obtained in the NTA JEE Main exam. The NTA employs a distinctive normalization formula to determine the relationship between JEE Main marks, percentiles, and ranks in 2025. This process helps students comprehend how their scores translate into percentiles and, ultimately, their rank in the JEE Main examination.
In JEE Main 2026 and onward, the National Testing Agency (NTA) determines percentile scores for Physics, Chemistry, and Mathematics using a standardized normalization formula. The top scorer in each subject is awarded a 100 percentile, ensuring fair comparison across multiple exam shifts.
To maintain accuracy and avoid ties, percentile scores are calculated up to seven decimal places. This system remains especially important for NRI Students in USA and students preparing from the Middle East (UAE), who often appear for different exam sessions.
Candidates can evaluate their JEE Main performance by understanding how their raw marks translate into percentiles, which are measured on a scale from 100 to 0, not as percentage marks. Using marks vs percentile trends and tools like the JEE Main college predictor, students—including NRI Students in USA and applicants from the Middle East (UAE)—can estimate admission possibilities across IITs, NITs, IIITs, and other engineering colleges.
Get JEE Prep Help Download NRI JEE E-BOOK
The JEE Main 2026 exam, conducted by NTA, is held across multiple dates and shifts, each with different question papers. Since slight difficulty variations are unavoidable, NTA uses a percentile-based normalisation process to ensure fairness.
Instead of raw marks, candidates are ranked based on relative performance within their shift. This system is especially important for NRI Students in USA and those appearing from the Middle East (UAE), ensuring equal evaluation across sessions. Percentile normalisation, as stated by NTA, provides a transparent and level playing field for all JEE Main aspirants
Check: Download JEE Main Syllabus PDF
The JEE Main 2026 exam, conducted by NTA, is held on multiple dates with two shifts per day. Since each shift may have different question papers and slight variations in difficulty, NTA follows a “Normalisation Procedure based on Percentile Score” to ensure fairness for all candidates, including NRI Students in USA and students appearing from the Middle East (UAE).
Under this process, percentile scores indicate the percentage of candidates who scored equal to or below a particular score in a given session. Percentiles are calculated on a scale of 100 to 0 for each subject (Physics, Chemistry, Mathematics) and the overall score. The highest scorer in a session receives a 100 percentile, while other marks are proportionately converted into percentiles.
Percentile scores are calculated up to seven decimal places to avoid ties and reduce score bunching. These percentiles, not raw marks, are used to prepare the final merit list. This normalisation method ensures a level playing field across sessions and remains crucial for students in India, NRI Students in USA, and aspirants from the Middle East (UAE) preparing for JEE Main 2026 and onward.
JEE Main percentile is calculated using a normalisation process, not raw marks. It compares a candidate’s performance with others within the same session (shift) to ensure fairness across different difficulty levels.

When two or more candidates secure the same percentile score in JEE Main 2026, the NTA tie-breaking rules are applied to determine the final rank. These rules remain consistent with recent years and are used to ensure fairness across all sessions.
The order of priority is as follows:
JEE Main Marks Vs Percentile Vs Rank (Previous Years)
JEE Percentile vs Marks 2021
| Score out of 300 | Percentile |
| 286- 292 | 99.99826992- 99.99890732 |
| 280-284 | 99.99617561 – 99.99790569 |
| 268- 279 | 99.99034797 – 99.99417236 |
| 250- 267 | 99.95228621- 99.99016586 |
| 231-249 | 99.87388626-99.95028296 |
| 215-230 | 99.74522293-99.87060821 |
| 200-214 | 99.57503767- 99.73930423 |
| 189-199 | 99.39319714- 99.56019541 |
| 175-188 | 99.02150308 – 99.3487614 |
| 160-174 | 98.52824811-98.99673561 |
| 149-159 | 98.07460288-98.49801724 |
| 132-148 | 97.0109678-97.97507774 |
| 120-131 | 96.0687115-96.93721175 |
| 110-119 | 95.05625037-95.983027 |
| 102-109 | 94.01228357-94.96737888 |
| 95-101 | 93.05600452 -93.89928202 |
| 89-94 | 92.05811248 -92.88745828 |
| 79-88 | 90.0448455 -91.79177119 |
| 62-87 | 84.56203931-91.59517945 |
| 41-61 | 70.26839007-84.22540213 |
| 1-40 | 6.66590786-69.5797271 |
JEE Main Marks vs Percentile 2021
| JEE main 2021 marks | JEE main 2021 percentile |
| 300-281 | 100 – 99.99989145 |
| 271 – 280 | 99.994681 – 99.997394 |
| 263 – 270 | 99.990990 – 99.994029 |
| 250 – 262 | 99.977205 – 99.988819 |
| 241 – 250 | 99.960163 – 99.975034 |
| 231 – 240 | 99.934980 – 99.956364 |
| 221 – 230 | 99.901113 – 99.928901 |
| 211 – 220 | 99.851616 – 99.893732 |
| 191 – 200 | 99.710831 – 99.782472 |
| 181 – 190 | 99.597399 – 99.688579 |
| 171 – 180 | 99.456939 – 99.573193 |
| 161 – 170 | 99.272084 – 99.431214 |
| 151 – 160 | 99.028614 – 99.239737 |
| 141 – 150 | 98.732389 – 98.990296 |
| 131 – 140 | 98.317414 – 98.666935 |
| 121 – 130 | 97.811260 – 98.254132 |
| 111 – 120 | 97.142937 – 97.685672 |
| 101 – 110 | 96.204550 – 96.978272 |
| 91 – 100 | 94.998594 – 96.064850 |
| 81 – 90 | 93.471231 – 94.749479 |
| 71 – 80 | 91.072128 – 93.152971 |
| 61 – 70 | 87.512225 – 90.702200 |
| 51 – 60 | 82.016062 – 86.907944 |
| 41 – 50 | 73.287808 – 80.982153 |
| 31 – 40 | 58.151490 – 71.302052 |
| 21 – 30 | 37.694529 – 56.569310 |
| 20 – 11 | 13.495849 – 33.229128 |
| 0 – 10 | 0.8435177 – 9.6954066 |
Enhance your JEE preparation further by downloading our exclusive NRI Quota Prep eBook. Tailored to cater to the needs of Non-Resident Indian students, this comprehensive guide complements, providing valuable insights and strategies for success. Don’t miss out on this essential resource – click to download and elevate your JEE readiness today!

Q1. What percentile corresponds to 80 marks in JEE Main 2026?
A score of around 80 marks in JEE Main 2026 generally corresponds to a percentile range of 85–90. The exact percentile may vary depending on exam difficulty, shift-wise performance, and the NTA normalisation process used for that session.
Q2. What percentile can be expected with 20 marks in JEE Main 2026?
Candidates scoring close to 20 marks in JEE Main 2026 can usually expect a percentile between 65 and 70. Since percentiles are relative, this range may slightly change based on overall candidate performance and session-wise difficulty.
Q3. How does 90 marks relate to percentile in JEE Main 2026?
Scoring around 90 marks in JEE Main 2026 is expected to result in a percentile range of 89–93. The final percentile depends on shift difficulty and how other candidates performed in the same examination session.
Q4. What percentile is associated with 100 marks in JEE Main 2026?
A score of approximately 100 marks in JEE Main 2026 generally translates to a percentile between 93 and 96. This estimate is based on trends from previous years and may vary slightly after normalisation.
Q5. What percentile can be expected with 150 marks in JEE Main 2026?
Candidates scoring around 150 marks in JEE Main 2026 can expect a high percentile, usually in the range of 98–99. Such scores typically place students in a strong position for NITs, IIITs, and GFTIs.
Q6. What percentile corresponds to 40 marks in JEE Main 2026?
A score of about 40 marks in JEE Main 2026 generally results in a percentile close to 70. The exact value may shift depending on exam difficulty and the performance distribution of candidates in that particular session.
Q7. What percentile range is required for admission to NITs?
For admission to NITs through JoSAA, candidates usually need a percentile between 86 and 96, depending on the branch, category, and home-state quota. Higher-demand branches typically require percentiles closer to the upper end.
Q8. Does marks vs percentile remain the same every year in JEE Main?
No, marks vs percentile does not remain fixed each year. It changes annually based on exam difficulty, number of candidates, and overall performance. NTA’s normalisation process ensures fair comparison across multiple shifts.
Q9. Why do candidates with similar marks get different percentiles?
Candidates with similar marks may receive different percentiles because percentiles are calculated session-wise. Variations in difficulty across shifts and relative performance within a session affect the final percentile after normalisation.
Q10. Are marks vs percentile figures exact or only estimates?
Marks vs percentile figures are approximate estimates based on previous years’ data. The final percentile is officially declared by NTA after applying the normalisation formula, so students should use these ranges only for guidance.


Copyright © 2024 CounselKart Educational Services Pvt. Ltd.. All Rights Reserved

Post a Comment