
CBSE Class 10th Mean of Grouped Data Details & Preparations Downloads
In the realm of statistics, understanding and calculating the mean of grouped data is a fundamental skill that Class 10 students delve into. The mean, also known as the average, provides a central measure that helps us grasp the central tendency of a dataset. Let's embark on a journey to unravel the intricacies of finding the mean for grouped data.
Effortless Learning with CBSE NCERT: Download and Master the Mean of Grouped Data
What is Grouped Data?
Grouped data refers to a collection of data that has been organized into groups or intervals. This organization is particularly useful when dealing with large datasets, as it condenses information while retaining its essence.
What is Meant by Mean in Statistics?
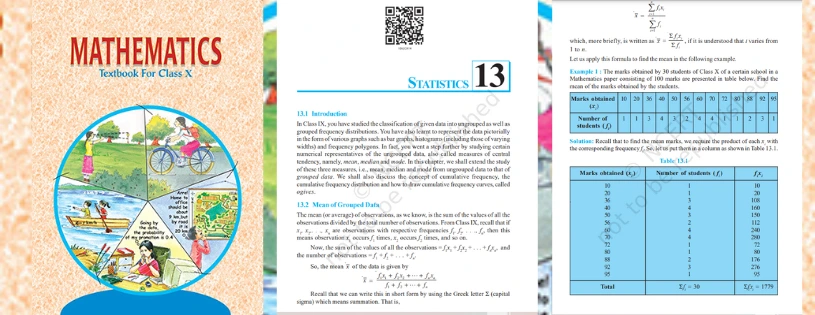
The mean or the average of the given observations is defined as the sum of the values of all the observations divided by the total number of observations. The mean of the data is generally represented by the notation x̄. If x1, x2, x3, …xn are the number of observations with respective frequencies f1, f2, f3, … fn, then
The sum of observations = f1x1+ f2x2 + f3x3 + ….+ fnxn.
The total number of observations = f1+f2+… + fn.
Therefore, the mean of the data, x̄ = (f1x1+ f2x2 + f3x3 + ….+ fnxn)/ ( f1+f2+… + fn).
In short, the above form can be represented using the summation (Σ).
Three Methods to Find the Mean of Grouped Data
In many scenarios, the data is large and to make a meaningful study, the data has to be condensed as grouped data. So, in those scenarios, we have to convert the ungrouped data into a grouped data and then find the mean. The three methods to find the mean of the grouped data is:
- Direct Method
- Assumed Mean Method
- Step-deviation Method.
Now, let us discuss all these three methods one by one.
Direct Method
Consider the same example as given above.
Now, convert the ungrouped data into grouped data by forming a class interval of width 15.
Note, that while taking the frequencies to each class interval, students falling in the upper-class limit will be considered in the next class interval.
Therefore, the grouped frequency distribution table for the above-given example is as follows:
| Class Interval | 10-25 | 25-40 | 40-55 | 55-70 | 70-85 | 85-100 |
| Number of Students | 2 | 3 | 7 | 6 | 6 | 6 |
Now, for each class interval, we need to find the midpoint (classmark) that serves as the representative of the whole class.
For example, for the first class interval, 10-25, the class mark is:
Class Mark = (Upper class limit + lower class limit)/2
Class Mark = (25+10)/2 = 17.5
Similarly, find the classmark for all the intervals.
Therefore, the mean of the marks obtained by the students is given as:
| Class Interval | Number of students (fi) | Class Mark (xi) | fixi |
| 10-25 | 2 | 17.5 | 35 |
| 25-40 | 3 | 32.5 | 97.5 |
| 40-55 | 7 | 47.5 | 332.5 |
| 55-70 | 6 | 62.5 | 375 |
| 70-85 | 6 | 77.5 | 465 |
| 85-100 | 6 | 92.5 | 555 |
| Total | Σfi = 30 | Σfixi = 1860 |
Table 2
Therefore, Mean, x̄ = 1860/30 = 62
The mean value obtained using the direct method is 62.
If you compare the mean obtained from Table 1 and Table 2, 59. 3 being the exact mean, whereas 62 is the approximate mean, because of the midpoint assumption in Table 2.
Assumed Mean Method
If the numerical values of xi and fi are large, finding the product of xi and fi becomes a time-consuming process. To reduce the calculations,
In this method, first, we need to choose the assumed mean, say “a” among the xi, which lies in the centre. (If we consider the same example, we can choose either a = 47.5 or 62.5). Now, let us choose a = 47.5.
The second step is to find the difference (di) between each xi and the assumed mean “a”.
The third step is to find the product of di with the corresponding fi.
| Class Interval | Number of students (fi) | Class Mark (xi) | di = xi – 47.5 | fidi |
| 10-25 | 2 | 17.5 | -30 | -60 |
| 25-40 | 3 | 32.5 | -15 | -45 |
| 40-55 | 7 | 47.5 | 0 | 0 |
| 55-70 | 6 | 62.5 | 15 | 90 |
| 70-85 | 6 | 77.5 | 30 | 180 |
| 85-100 | 6 | 92.5 | 45 | 270 |
| Total | Σfi = 30 | Σfidi = 435. |
Now, substitute the values of a, Σfi , and Σfidi in the above formula to get the mean,
Therefore, x̄ = 47.5 + (435/30)
x̄ = 47.5 + 14.5
x̄ = 62.
Therefore, the mean of the marks obtained by the class 10 students is 62.
Hence, the result obtained from the direct method and assumed mean method is the same.
Step Deviation Method
Consider the same example as given above. In the step deviation method, we will add one more column to the table to find the mean, which is ui = (xi – a)/h
Where “a” is the assumed mean and “h” is the class size, which is equal to 15 (i.e) width of the class interval.
| Class Interval | Number of students (fi) | Class Mark (xi) | di = xi – 47.5
di = xi – a |
ui =(xi – a)/h
(h=15) |
fiui |
| 10-25 | 2 | 17.5 | -30 | -2 | -4 |
| 25-40 | 3 | 32.5 | -15 | -1 | -3 |
| 40-55 | 7 | 47.5 | 0 | 0 | 0 |
| 55-70 | 6 | 62.5 | 15 | 1 | 6 |
| 70-85 | 6 | 77.5 | 30 | 2 | 12 |
| 85-100 | 6 | 92.5 | 45 | 3 | 18 |
| Total | Σfi = 30 | Σfiui = 29 |
CBSE Class 10th Downloadable Resources:
| 1. CBSE Class 10th Topic Wise Summary | View Page / Download |
| 2. CBSE Class 10th NCERT Books | View Page / Download |
| 3. CBSE Class 10th NCERT Solutions | View Page / Download |
| 4. CBSE Class 10th Exemplar | View Page / Download |
| 5. CBSE Class 10th Previous Year Papers | View Page / Download |
| 6. CBSE Class 10th Sample Papers | View Page / Download |
| 7. CBSE Class 10th Question Bank | View Page / Download |
| 8. CBSE Class 10th Topic Wise Revision Notes | View Page / Download |
| 9. CBSE Class 10th Last Minutes Preparation Resources (LMP) | View Page / Download |
| 10. CBSE Class 10th Best Reference Books | View Page / Download |
| 11. CBSE Class 10th Formula Booklet | View Page / Download |
Being in CBSE class 10th and considering the board examinations you must be needing resources to excel in your examinations. At TestprepKart we take great pride in providing CBSE class 10th all study resources in downloadable form for you to keep you going.
Below is the list of all CBSE class 10th Downloads available on TestprepKart for both Indian and NRI students preparing for CBSE class 10th in UAE, Oman, Qatar, Kuwait & Bahrain.
SAMPLE PRACTICE QUESTION
Q1: What does "grouped data" mean in statistics, and why is it used?
Ans: Grouped data is a way of organizing a large set of data into intervals or groups. It's employed to simplify the representation of data and draw meaningful insights.
Q2: Why is the mean of grouped data considered a measure of central tendency?
Ans: The mean provides a central value that represents the average of the entire dataset, making it a valuable measure of central tendency in statistics.
Q3: What is the significance of midpoints in finding the mean of grouped data?
Ans: Midpoints are crucial because they represent the approximate value for each group, allowing us to calculate a representative mean for the entire dataset.
Q4: Can you explain the step-by-step process for calculating the mean of grouped data?
Ans: Certainly! First, find the midpoint of each group. Multiply the midpoint by its frequency, sum up these products, and finally divide by the total number of observations.
Q5: How does one deal with open-ended intervals when calculating the mean for grouped data?
Ans: For open-ended intervals, an assumed width is used. The midpoint is calculated based on this assumed width, ensuring consistency in the calculation.