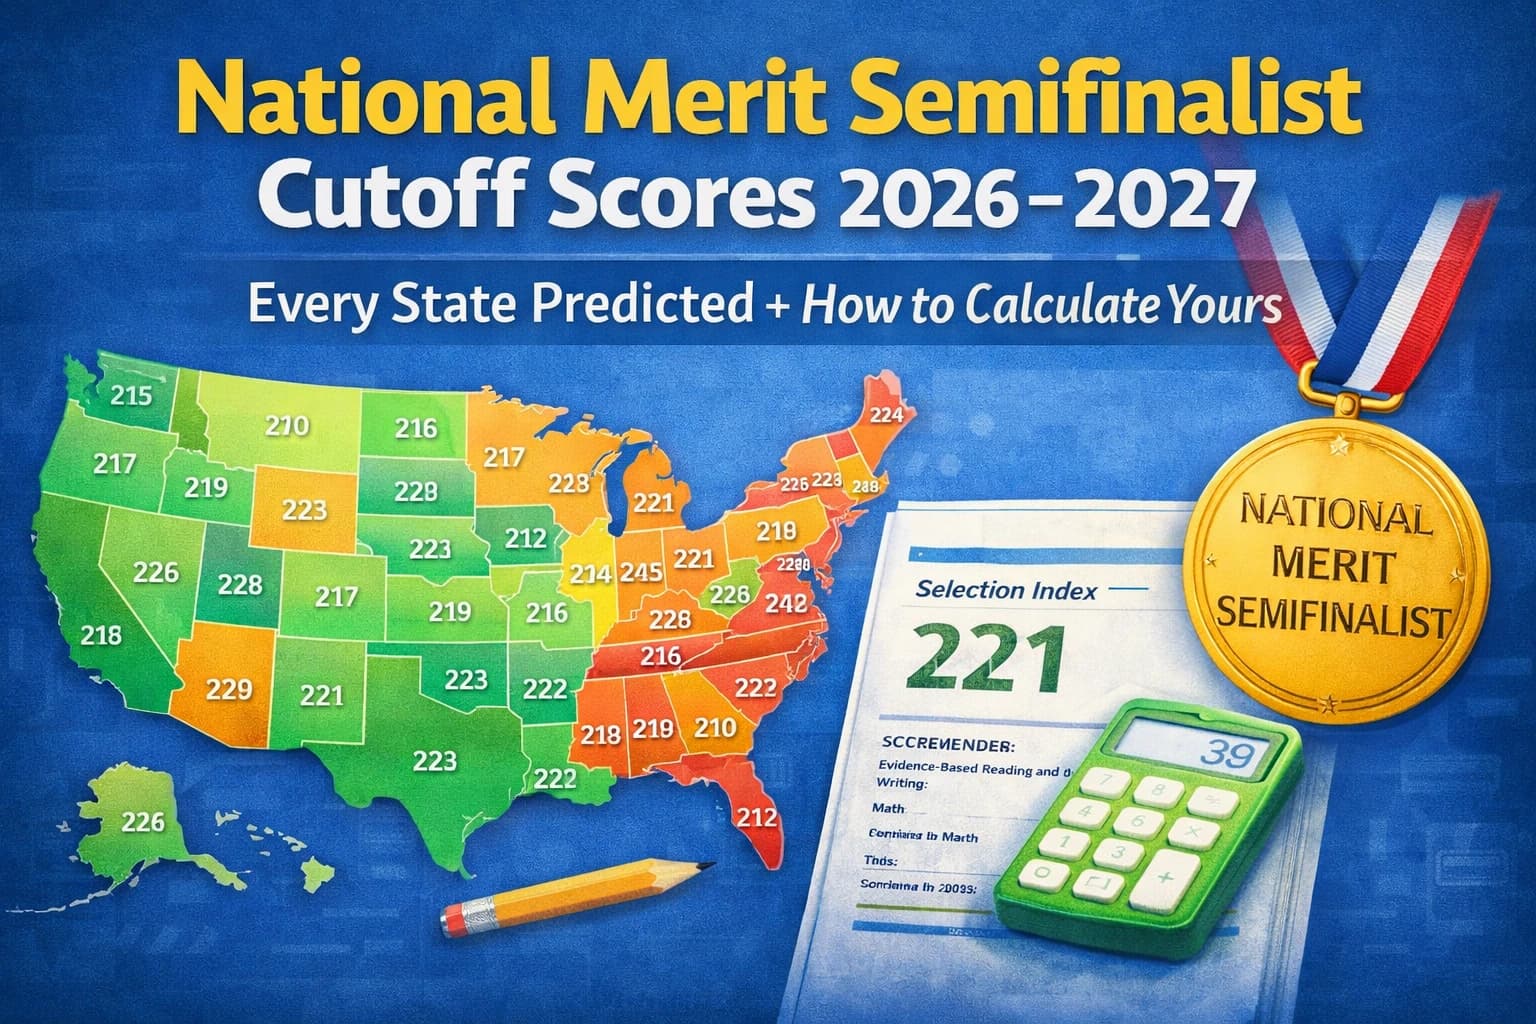
National Merit Semifinalist Cutoff Scores 2026–2027: Every State Predicted + How to Calculate Yours
Last Updated: March 2026 | Class of 2027 PSAT Taken: October 2025 | Official Cutoffs Released: September 2026
Table of Contents
- What Is the National Merit Semifinalist Cutoff?
- How Is the Selection Index Calculated?
- Why Are Cutoffs Predicted to Drop for Class of 2027?
- What Caused the Record-High Cutoffs for Class of 2026?
- Class of 2027 Predicted Semifinalist Cutoff Scores All States
- How to Read the Table
- Why Does Every State Have a Different Cutoff?
- When Will Official Cutoffs Be Released?
- Do PSAT Percentiles Tell You If You'll Be a Semifinalist?
- Eligibility vs. Qualifying
- Historical Context
- Frequently Asked Questions
- What Should You Do Now?
What Is the National Merit Semifinalist Cutoff?
About 57,000 of the 1.4 million juniors who take the PSAT/NMSQT each year get National Merit recognition from the National Merit Scholarship Corporation (NMSC). That is roughly the top four percent of all test takers.
Who becomes a Semifinalist?
The top 17,000 students in that group, or about 1% of all test-takers, are called Semifinalists. They have the highest Selection Index scores in their states.
Who becomes a Commended Student?
The other 40,000 students who earn recognition are called Commended Students.
How Is the Selection Index Calculated?
The PSAT is not scored simply on a 1600 scale for National Merit purposes. Instead, NMSC uses a separate formula called the Selection Index.
| Student | RW Score | Math Score | Calculation | Selection Index |
|---|---|---|---|---|
| Student A | 720 | 700 | (720×2 + 700) ÷ 10 | 214 |
| Student B | 700 | 720 | (700×2 + 720) ÷ 10 | 212 |
| Student C | 760 | 760 | (760×2 + 760) ÷ 10 | 228 (Max) |
| Student D | 730 | 690 | (730×2 + 690) ÷ 10 | 215 |
Same total score, different SI
Two students can have the same PSAT total score of 1420 but different Selection Indexes.
- 710 RW and 710 Math = SI 213
- 680 RW and 740 Math = SI 210
Why this matters
A student who is stronger in Reading and Writing has a structural advantage over a student with the same overall score but stronger Math. When preparing for National Merit, remember that RW is weighted more heavily.
Why Are Cutoffs Predicted to Drop for Class of 2027?
This is the central conclusion for the Class of 2027: the data strongly supports a meaningful decline from last year's unprecedented highs.
The most important data point
Compared to the Class of 2026, the number of students who scored 1400 or higher on the October 2025 PSAT dropped by about 16%.
What that means
About 52,400 students scored 1400 or higher on the PSAT in 2025, a level similar to the Class of 2025 and older normal years like the classes of 2017 and 2021.
Why it lowers cutoffs
Fewer very high scores means fewer students at the Semifinalist level, which lowers predicted state cutoffs.
The RW score collapse
- There was an 18% rise in students scoring 700–760 on RW on the 2024 PSAT (Class of 2026)
- Those high RW scores dropped by 27% on the 2025 PSAT (Class of 2027)
- The number of high RW scores for the Class of 2027 is even lower than it was two years ago
Why RW matters so much
Since RW counts twice in the Selection Index, a major drop in high RW scores strongly pushes Semifinalist cutoffs downward.
The natural Math-to-RW balance also returned to normal. In 2024, almost as many students scored 700–760 on RW as on Math, which was unusual. For the Class of 2027, the ratio is back near normal historical patterns.
What Caused the Record-High Cutoffs for Class of 2026?
The Class of 2026 produced shockingly high cutoff scores. States that usually sat around 218–220 jumped to 222–225. The evidence suggests this was a one-time anomaly rather than a true leap in student ability.
| Format | RW Questions | RW Time | Questions That Count |
|---|---|---|---|
| Paper PSAT | 91 questions | 95 minutes | 91 |
| Digital PSAT | 54 questions | 64 minutes | 50 |
The Digital PSAT transition problem
A shorter test is inherently less reliable. With fewer questions, individual outcomes become more variable and harder to scale consistently.
College Board likely lost control of the scale
The evidence strongly suggests that the 2024 PSAT was built or scaled incorrectly, especially on Reading and Writing. Too many high RW scores were awarded, which inflated Selection Indexes nationwide.
Class of 2027 Predicted Semifinalist Cutoff Scores: All States
These are analytical estimates based on October 2025 PSAT score distributions. Official cutoffs will be released by NMSC in September 2026. The Commended cutoff typically leaks in April 2026.
| State | Most Likely (2027) | Estimated Range | 2026 Actual | 2025 Actual | 2024 Actual | Avg. NMSFs |
|---|---|---|---|---|---|---|
| Alabama | 213 | 210–216 | 214 | 212 | 210 | 250 |
| Alaska | 214 | 210–216 | 215 | 214 | 209 | 35 |
| Arizona | 218 | 215–220 | 218 | 217 | 216 | 398 |
| Arkansas | 213 | 210–216 | 215 | 213 | 210 | 143 |
| California | 223 | 220–224 | 224 | 221 | 221 | 2,115 |
| Colorado | 218 | 216–221 | 219 | 218 | 216 | 286 |
| Connecticut | 222 | 220–223 | 223 | 221 | 221 | 175 |
| Delaware | 219 | 218–221 | 220 | 219 | 219 | 44 |
| Florida | 217 | 216–220 | 219 | 217 | 216 | 999 |
| Georgia | 219 | 217–221 | 220 | 218 | 217 | 602 |
| Hawaii | 218 | 215–220 | 219 | 217 | 217 | 62 |
| Idaho | 214 | 211–217 | 215 | 213 | 211 | 96 |
| Illinois | 220 | 218–222 | 222 | 220 | 219 | 704 |
| Indiana | 217 | 214–219 | 218 | 217 | 216 | 313 |
| Iowa | 213 | 211–216 | 214 | 212 | 210 | 145 |
| Kansas | 216 | 213–219 | 216 | 215 | 214 | 144 |
| Kentucky | 214 | 211–217 | 214 | 213 | 211 | 201 |
| Louisiana | 215 | 212–218 | 216 | 214 | 214 | 222 |
| Maine | 215 | 212–217 | 217 | 214 | 213 | 55 |
| Maryland | 223 | 221–225 | 224 | 222 | 221 | 308 |
| Massachusetts | 223 | 221–225 | 225 | 223 | 222 | 318 |
| Michigan | 219 | 216–220 | 220 | 218 | 217 | 485 |
| Minnesota | 218 | 216–220 | 219 | 217 | 216 | 279 |
| Mississippi | 213 | 210–215 | 213 | 212 | 209 | 155 |
| Missouri | 216 | 213–218 | 217 | 215 | 214 | 289 |
| Montana | 211 | 208–214 | 213 | 209 | 209 | 47 |
| Nebraska | 213 | 210–216 | 214 | 211 | 210 | 105 |
| Nevada | 214 | 211–217 | 214 | 214 | 211 | 168 |
| New Hampshire | 217 | 214–219 | 219 | 217 | 215 | 60 |
| New Jersey | 223 | 222–225 | 225 | 223 | 223 | 451 |
| New Mexico | 211 | 208–214 | 210 | 211 | 207 | 104 |
| New York | 221 | 219–223 | 223 | 220 | 220 | 1,012 |
| North Carolina | 219 | 216–221 | 220 | 218 | 217 | 510 |
| North Dakota | 210 | 207–212 | 210 | 210 | 207 | 30 |
| Ohio | 218 | 215–220 | 219 | 217 | 216 | 538 |
| Oklahoma | 212 | 208–214 | 212 | 211 | 208 | 204 |
| Oregon | 218 | 215–220 | 219 | 216 | 216 | 188 |
| Pennsylvania | 220 | 217–222 | 221 | 219 | 219 | 596 |
| Rhode Island | 217 | 214–220 | 219 | 217 | 215 | 47 |
| South Carolina | 214 | 210–217 | 215 | 214 | 209 | 236 |
| South Dakota | 210 | 207–213 | 211 | 208 | 209 | 42 |
| Tennessee | 218 | 215–219 | 219 | 217 | 217 | 319 |
| Texas | 221 | 218–222 | 222 | 219 | 219 | 1,623 |
| Utah | 212 | 210–216 | 213 | 211 | 209 | 196 |
| Vermont | 215 | 211–217 | 216 | 215 | 212 | 28 |
| Virginia | 222 | 220–224 | 224 | 222 | 219 | 437 |
| Washington | 222 | 220–224 | 224 | 222 | 220 | 348 |
| West Virginia | 209 | 207–212 | 210 | 209 | 207 | 64 |
| Wisconsin | 214 | 213–217 | 215 | 214 | 213 | 292 |
| Wyoming | 209 | 207–212 | 210 | 209 | 207 | 24 |
| District of Columbia | 223 | 222–225 | 225 | 223 | 223 | 36 |
| U.S. Territories | 209 | 207–211 | 210 | 208 | 207 | 39 |
| Outside the U.S. | 223 | 222–225 | 225 | 223 | 223 | 86 |
| Commended | 209 | 207–210 | 210 | 208 | 207 | — |
How to Read the Table: Most Likely vs. Estimated Range
Most Likely
Based on the national score distribution data available, this is the most likely cutoff score. Think of it as the average expectation.
Estimated Range
This is where the cutoff will most likely land. A cutoff can move a full point in either direction even without major shifts in performance because scores cluster at certain levels and smaller states allocate very few semifinalist slots.
Why the range matters more than the point estimate
- In smaller states with fewer than 100 semifinalists, a handful of students can move the cutoff by 1–2 points
- Even large states like New Jersey and Massachusetts often land at the edge of their predicted ranges
- If your score is inside the estimated range, you are genuinely in contention
Rule of thumb
- If you score at or above the Most Likely level, you have a good chance of qualifying
- If you score within the Estimated Range, you are on the edge and should wait for the Commended cutoff in April for more context
- If your score is below the Estimated Range, you probably will not qualify this year, though Commended recognition may still be possible
Why Does Every State Have a Different Cutoff?
This is one of the most common and most debated questions about National Merit.
The allocation system
NMSC does not simply rank all 1.4 million test-takers nationally and select the top 17,000. Instead, each state receives a certain number of Semifinalist slots based on the number of high school graduates in that state.
- California gets about 2,100 semifinalist spots
- Wyoming gets about 24 semifinalist spots
The result
Students are ranked within their own state, and NMSC selects from the top down until the allocation is filled. This creates major differences in required cutoffs from state to state.
Important guidelines
- The national Commended cutoff cannot be lower than any state cutoff
- The D.C. cutoff is always the highest cutoff for any state, usually matching New Jersey or Massachusetts
- The Commended level is used as the cutoff for U.S. territories
- U.S. students living abroad are held to the highest state cutoff
- Boarding schools use the highest state cutoff in their region
The school-location rule
The student's home address does not determine the cutoff. Only the location of the school they attend matters. If a Nevada student attends school in California, that student must meet California's cutoff even if they pursue alternate entry.
When Will Official Cutoffs Be Released?
| Event | Expected Timing |
|---|---|
| Commended cutoff informal leak | April 2026 |
| Semifinalist lists distributed to high schools | Late August 2026 |
| Schools notify individual students | Late August – Early September 2026 |
| Press embargo lifted; public announcements | Mid-September 2026 |
| Commended Student letters sent to schools | Mid-September 2026 |
| Finalist announcements | February 2027 |
| Scholarship winners announced | Spring/Summer 2027 |
Do PSAT Percentiles Tell You If You'll Be a National Merit Semifinalist?
Percentiles use total score, not Selection Index
National Merit ranks students by Selection Index, which gives RW double weight, not by total score on the 1520 scale.
Percentiles are rounded harshly
From a National Merit perspective, the difference between the top 0.51% and top 1.49% is huge, but both can still show as “99th percentile.”
Percentiles are based on prior-year data
The percentile bands on your score report are based on the previous three years of PSATs, not the test you just took.
Semifinalist slots depend on graduates, not test-takers
States with more PSAT participants are not necessarily granted more relative opportunity. Percentiles do not capture state-specific competition.
The “at the cutoff” issue matters
Percentiles count students scoring “at or below” a level, while NMSC includes all students at the cutoff when filling allocations. That creates more mismatch.
PSAT Eligibility Requirements vs. Qualifying for National Merit
Eligibility (entry requirements)
- Be enrolled as a junior (11th grade) in the U.S.
- Take the PSAT/NMSQT in October of junior year
- Plan to enroll full-time in college no later than the fall following high school graduation
- Answer the entrance questions on the test correctly
If your score report shows an asterisk (*) next to your Selection Index, your answers may indicate ineligibility. Review the report and contact NMSC if you think there is an error.
Qualifying (the competitive part)
Being eligible only means your score will be considered.
- About 1.4 million students enter the competition each year
- About 17,000 become Semifinalists
- About 40,000 become Commended Students
- Finalists and Scholars are subsets of Semifinalists
Historical Context: How Cutoffs Have Changed Over Time
Cutoffs are never static
In most years, more than half of all states see their cutoff change. In more volatile years, 45–49 states have seen movement.
Problematic exam years matter
Exams from 2011, 2016, 2019, and 2024 produced unusual score distributions and unexpected cutoff shifts.
Smaller states are more volatile
- The 12 largest states held steady about 36% of the time over the past 12 years
- The smallest states held steady only about 20% of the time
- Large states rarely jump more than 3 points in a year
- Small states have seen 6-point swings
What the Class of 2027 represents
The Class of 2026 surge now appears unprecedented and likely tied to a mis-scaled digital exam. The Class of 2027 looks much more like a return to normal historical patterns, particularly those seen around 2021 and 2023.
Frequently Asked Questions
What is the highest possible Selection Index?
What is the Selection Index formula?
My score is right at the predicted cutoff. Should I be hopeful?
Is there any way to appeal a National Merit decision?
What is the difference between Semifinalist, Finalist, Commended Student, and Scholar?
Semifinalist: Top scores in your state, around 17,000 per year.
Finalist: Semifinalists who complete the required application, transcript, essay, recommendation, and confirmation score. About 15,000 per year advance.
Scholar: Finalists who receive a National Merit Scholarship. About 7,500 per year.
Can homeschooled students qualify for National Merit?
My child goes to school in a different state than we live in. Which state's cutoff applies?
Does a boarding school student compete in the state where the boarding school is located?
When does the Commended cutoff get announced?
My state's Most Likely cutoff is 218 but my SI is 216. Is it over?
Why did so many cutoffs jump drastically in 2025 (Class of 2026)?
Are National Merit cutoffs the same as PSAT “Merit Scholarship Qualifying Test” scores?
What Should You Do Now?
If you already have your PSAT score (Class of 2027)
- Calculate your Selection Index using the formula above
- Compare your SI to the Most Likely and Estimated Range for your state
- If you are borderline, watch April 2026 closely because the Commended cutoff gives valuable signals
- If your score is comfortably above the range, begin thinking about the Finalist application process: essay, transcript, recommendation
- If you are well below the range, aim for Commended recognition and shift focus to SAT/ACT strategy for college admissions
If you are a sophomore (Class of 2028) preparing for the PSAT
- Understand the Selection Index formula and remember that RW matters more than Math
- Study your state's historical cutoffs to set a realistic target
- Take PSAT practice tests using official College Board materials
- Focus on eliminating RW errors, because a 10-point gain in RW is worth 20 points in Selection Index
- Keep checking this page for updates when the Commended cutoff leaks in spring and official cutoffs are released in fall 2026
PSAT Prep Handbook & National Merit Guide Download
A practical guide covering PSAT structure, score reporting, National Merit strategy, cutoff understanding, and grade-wise planning. Designed to help families avoid confusion around PSAT purpose, scoring, and scholarship opportunities.
Tip: Keep this PSAT handbook open while planning grade-wise prep, National Merit goals, and future SAT strategy.
Schedule Trial Session For PSAT Prep
Get a short diagnostic and PSAT study roadmap: current level, Reading & Writing weaknesses, Math gaps, National Merit potential, and the exact weekly plan needed to improve performance with structure.
Best for: Students in Grade 8–11 who want a clear PSAT plan, stronger score growth, and better National Merit preparation.